 Web Server Statistics for PHPBB Forums
Program started at Sun-31-Oct-2010 07:35.
Analysed requests from Sun-24-Oct-2010 00:13 to Sun-31-Oct-2010 07:01 (7.28 days).
Web Server Statistics for PHPBB ForumsProgram started at Sun-31-Oct-2010 07:35.
Analysed requests from Sun-24-Oct-2010 00:13 to Sun-31-Oct-2010 07:01 (7.28 days).
(Go To: Top | General Summary | Daily Report | Hourly Summary | Organisation Report | Referrer Report | Referring Site Report | Browser Summary | Operating System Report | Status Code Report | File Size Report | File Type Report | Directory Report | Request Report)
This report contains overall statistics.
Figures in parentheses refer to the 7-day period ending 31-Oct-2010 07:35.
Successful requests: 1,950 (1,874)
Average successful requests per day: 267 (267)
Successful requests for pages: 1,492 (1,434)
Average successful requests for pages per day: 204 (204)
Failed requests: 155 (152)
Distinct files requested: 786 (758)
Distinct hosts served: 3 (3)
Data transferred: 11.45 megabytes (11.02 megabytes)
Average data transferred per day: 1.57 megabytes (1.57 megabytes)
(Go To: Top | General Summary | Daily Report | Hourly Summary | Organisation Report | Referrer Report | Referring Site Report | Browser Summary | Operating System Report | Status Code Report | File Size Report | File Type Report | Directory Report | Request Report)
This report lists the activity in each day.
Each unit ( ) represents 6 requests for pages or part thereof.
| date | reqs | pages | |
|---|---|---|---|
| 24/Oct/10 | 233 | 187 |  |
| 25/Oct/10 | 281 | 189 | |
| 26/Oct/10 | 351 | 219 |  |
| 27/Oct/10 | 266 | 225 |  |
| 28/Oct/10 | 238 | 197 | |
| 29/Oct/10 | 258 | 215 | |
| 30/Oct/10 | 275 | 217 | |
| 31/Oct/10 | 48 | 43 |  |
Busiest day: 27/Oct/10 (225 requests for pages).
(Go To: Top | General Summary | Daily Report | Hourly Summary | Organisation Report | Referrer Report | Referring Site Report | Browser Summary | Operating System Report | Status Code Report | File Size Report | File Type Report | Directory Report | Request Report)
This report lists the total activity for each hour of the day, summed over all the days in the report.
Each unit () represents 2 requests for pages or part thereof.
| hour | reqs | pages | |
|---|---|---|---|
| 0 | 59 | 35 |  |
| 1 | 65 | 65 | |
| 2 | 75 | 56 | |
| 3 | 71 | 71 | |
| 4 | 84 | 80 | |
| 5 | 55 | 54 | |
| 6 | 53 | 49 | |
| 7 | 74 | 74 | |
| 8 | 59 | 55 | |
| 9 | 58 | 54 | |
| 10 | 94 | 73 | |
| 11 | 58 | 58 | |
| 12 | 99 | 67 | |
| 13 | 132 | 81 | |
| 14 | 87 | 70 | |
| 15 | 41 | 41 | |
| 16 | 115 | 61 | |
| 17 | 100 | 55 | |
| 18 | 55 | 55 | |
| 19 | 58 | 57 | |
| 20 | 205 | 92 | |
| 21 | 34 | 34 | |
| 22 | 77 | 76 | |
| 23 | 142 | 79 | |
(Go To: Top | General Summary | Daily Report | Hourly Summary | Organisation Report | Referrer Report | Referring Site Report | Browser Summary | Operating System Report | Status Code Report | File Size Report | File Type Report | Directory Report | Request Report)
This report lists the organisations of the computers which requested files.
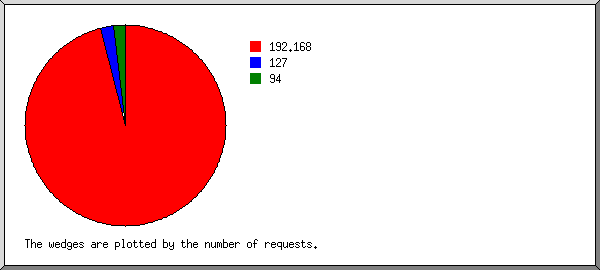
Listing organisations, sorted by the number of requests.
| reqs | %bytes | organisation |
|---|---|---|
| 1872 | 98.43% | 192.168 |
| 43 | 127 | |
| 35 | 1.57% | 94 |
(Go To: Top | General Summary | Daily Report | Hourly Summary | Organisation Report | Referrer Report | Referring Site Report | Browser Summary | Operating System Report | Status Code Report | File Size Report | File Type Report | Directory Report | Request Report)
This report lists the referrers (where people followed links from, or pages which included this site's images).
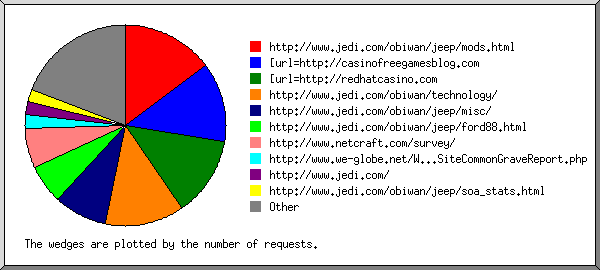
Listing referring URLs, sorted by the number of requests.
(Go To: Top | General Summary | Daily Report | Hourly Summary | Organisation Report | Referrer Report | Referring Site Report | Browser Summary | Operating System Report | Status Code Report | File Size Report | File Type Report | Directory Report | Request Report)
This report lists which servers people followed links from.
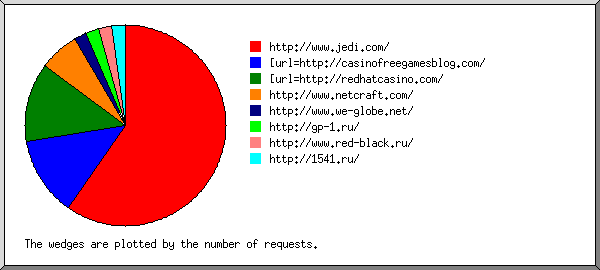
Listing referring sites, sorted by the number of requests.
| reqs | site |
|---|---|
| 28 | http://www.jedi.com/ |
| 6 | [url=http://casinofreegamesblog.com/ |
| 6 | [url=http://redhatcasino.com/ |
| 3 | http://www.netcraft.com/ |
| 1 | http://www.we-globe.net/ |
| 1 | http://gp-1.ru/ |
| 1 | http://www.red-black.ru/ |
| 1 | http://1541.ru/ |
(Go To: Top | General Summary | Daily Report | Hourly Summary | Organisation Report | Referrer Report | Referring Site Report | Browser Summary | Operating System Report | Status Code Report | File Size Report | File Type Report | Directory Report | Request Report)
This report lists the vendors of visitors' browsers.
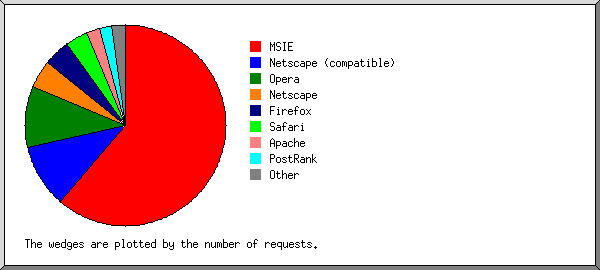
Listing browsers with at least 10 requests, sorted by the number of requests.
| no. | %reqs | reqs | pages | browser |
|---|---|---|---|---|
| 1 | 61.23% | 1194 | 940 | MSIE |
| 37.28% | 727 | 693 | MSIE/6 | |
| 12.51% | 244 | 30 | MSIE/8 | |
| 7.64% | 149 | 149 | MSIE/5 | |
| 2.51% | 49 | 43 | MSIE/7 | |
| 0.62% | 12 | 12 | MSIE/3 | |
| 0.51% | 10 | 10 | MSIE/4 | |
| 0.15% | 3 | 3 | MSIE/2 | |
| 2 | 10.21% | 199 | 165 | Netscape (compatible) |
| 3 | 9.85% | 192 | 192 | Opera |
| 3.90% | 76 | 76 | Opera/9 | |
| 3.79% | 74 | 74 | Opera/7 | |
| 1.54% | 30 | 30 | Opera/8 | |
| 0.62% | 12 | 12 | Opera/6 | |
| 4 | 4.56% | 89 | 89 | Netscape |
| 2.21% | 43 | 43 | Netscape/4 | |
| 1.74% | 34 | 34 | Netscape/0 | |
| 0.62% | 12 | 12 | Netscape/3 | |
| 5 | 4.21% | 82 | 16 | Firefox |
| 3.79% | 74 | 8 | Firefox/3 | |
| 0.26% | 5 | 5 | Firefox/2 | |
| 0.15% | 3 | 3 | Firefox/0 | |
| 6 | 3.59% | 70 | 14 | Safari |
| 2.62% | 51 | 12 | Safari/534 | |
| 0.97% | 19 | 2 | Safari/533 | |
| 7 | 2.21% | 43 | 0 | Apache |
| 2.21% | 43 | 0 | Apache/2 | |
| 8 | 1.95% | 38 | 38 | PostRank |
| 1.95% | 38 | 38 | PostRank/2 | |
| 9 | 0.82% | 16 | 11 | Baiduspider+(+http: |
| 0.82% | 16 | 11 | Baiduspider+(+http://www | |
| 1.38% | 27 | 27 | [not listed: 10 browsers] |
(Go To: Top | General Summary | Daily Report | Hourly Summary | Organisation Report | Referrer Report | Referring Site Report | Browser Summary | Operating System Report | Status Code Report | File Size Report | File Type Report | Directory Report | Request Report)
This report lists the operating systems used by visitors.
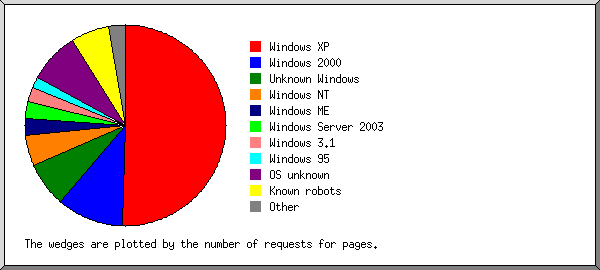
Listing operating systems, sorted by the number of requests for pages.
| no. | %reqs | reqs | pages | OS |
|---|---|---|---|---|
| 1 | 83.54% | 1629 | 1270 | Windows |
| 48.21% | 940 | 753 | Windows XP | |
| 8.21% | 160 | 160 | Windows 2000 | |
| 14.00% | 273 | 107 | Unknown Windows | |
| 3.79% | 74 | 74 | Windows NT | |
| 2.10% | 41 | 41 | Windows ME | |
| 2.36% | 46 | 40 | Windows Server 2003 | |
| 1.85% | 36 | 36 | Windows 3.1 | |
| 1.33% | 26 | 26 | Windows 95 | |
| 1.08% | 21 | 21 | Windows 98 | |
| 0.62% | 12 | 12 | Windows CE | |
| 2 | 8.56% | 167 | 123 | OS unknown |
| 3 | 6.67% | 130 | 92 | Known robots |
| 4 | 0.26% | 5 | 5 | Unix |
| 0.26% | 5 | 5 | Linux | |
| 5 | 0.97% | 19 | 2 | Macintosh |
(Go To: Top | General Summary | Daily Report | Hourly Summary | Organisation Report | Referrer Report | Referring Site Report | Browser Summary | Operating System Report | Status Code Report | File Size Report | File Type Report | Directory Report | Request Report)
This report lists the HTTP status codes of all requests.
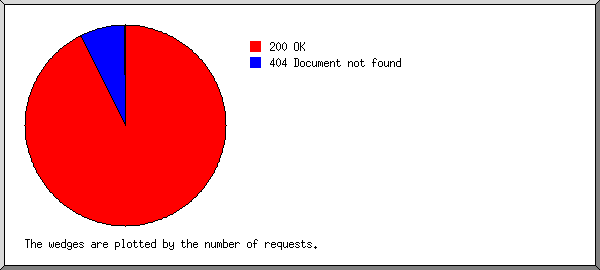
Listing status codes, sorted numerically.
| reqs | status code |
|---|---|
| 1950 | 200 OK |
| 1 | 400 Bad request |
| 154 | 404 Document not found |
(Go To: Top | General Summary | Daily Report | Hourly Summary | Organisation Report | Referrer Report | Referring Site Report | Browser Summary | Operating System Report | Status Code Report | File Size Report | File Type Report | Directory Report | Request Report)
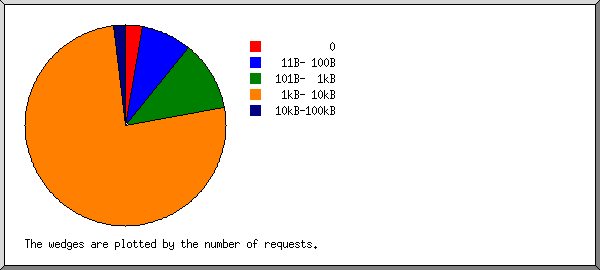
This report lists the sizes of files.
| size | reqs | %bytes |
|---|---|---|
| 0 | 54 | |
| 1B- 10B | 0 | |
| 11B- 100B | 159 | 0.06% |
| 101B- 1kB | 219 | 0.60% |
| 1kB- 10kB | 1482 | 78.80% |
| 10kB-100kB | 36 | 20.53% |
(Go To: Top | General Summary | Daily Report | Hourly Summary | Organisation Report | Referrer Report | Referring Site Report | Browser Summary | Operating System Report | Status Code Report | File Size Report | File Type Report | Directory Report | Request Report)
This report lists the extensions of files.
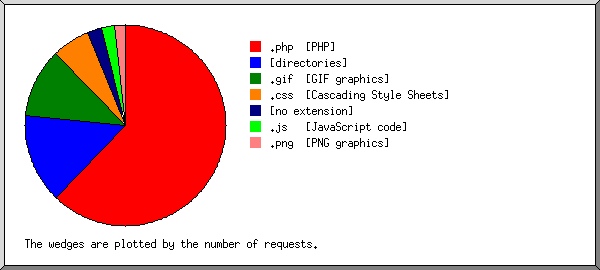
Listing extensions, sorted by the number of requests.
| reqs | %bytes | extension |
|---|---|---|
| 1211 | 82.72% | .php [PHP] |
| 281 | 14.05% | [directories] |
| 218 | 1.24% | .gif [GIF graphics] |
| 121 | 0.78% | .css [Cascading Style Sheets] |
| 45 | [no extension] | |
| 40 | 1.15% | .js [JavaScript code] |
| 34 | 0.06% | .png [PNG graphics] |
(Go To: Top | General Summary | Daily Report | Hourly Summary | Organisation Report | Referrer Report | Referring Site Report | Browser Summary | Operating System Report | Status Code Report | File Size Report | File Type Report | Directory Report | Request Report)
This report lists the directories from which files were requested. (The figures for each directory include all of its subdirectories.)
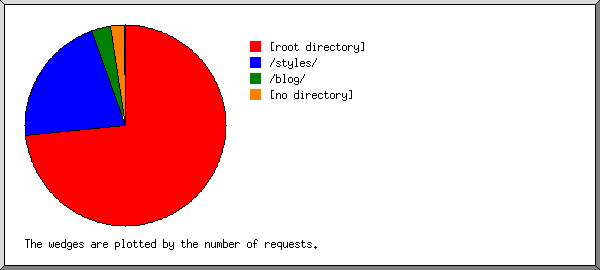
Listing directories, sorted by the number of requests.
| reqs | %reqs | %pages | directory |
|---|---|---|---|
| 1431 | 73.38% | 95.91% | [root directory] |
| 413 | 21.18% | /styles/ | |
| 413 | 21.18% | /styles/prosilver/ | |
| 62 | 3.18% | 4.02% | /blog/ |
| 2 | 0.10% | /blog/trackback.php/ | |
| 43 | 2.21% | [no directory] | |
| 1 | 0.05% | 0.07% | http:// |
(Go To: Top | General Summary | Daily Report | Hourly Summary | Organisation Report | Referrer Report | Referring Site Report | Browser Summary | Operating System Report | Status Code Report | File Size Report | File Type Report | Directory Report | Request Report)
This report lists the files on the site.
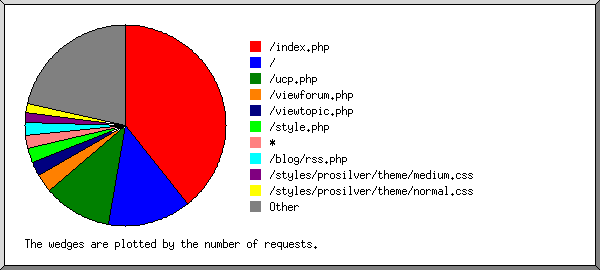
Listing files with at least 20 requests, sorted by the number of requests.
| reqs | %bytes | last time | file |
|---|---|---|---|
| 767 | 42.40% | 31/Oct/10 05:11 | /index.php |
| 259 | 14.04% | 31/Oct/10 06:55 | / |
| 213 | 11.92% | 31/Oct/10 05:11 | /ucp.php |
| 59 | 3.11% | 31/Oct/10 04:08 | /viewforum.php |
| 18 | 0.98% | 31/Oct/10 04:08 | /viewforum.php?f=4 |
| 13 | 0.70% | 30/Oct/10 23:25 | /viewforum.php?f=17 |
| 46 | 2.35% | 31/Oct/10 07:01 | /viewtopic.php |
| 44 | 20.53% | 31/Oct/10 04:03 | /style.php |
| 43 | 28/Oct/10 22:02 | * | |
| 38 | 0.03% | 31/Oct/10 05:29 | /blog/rss.php |
| 31 | 0.01% | 31/Oct/10 04:03 | /styles/prosilver/theme/medium.css |
| 30 | 0.01% | 31/Oct/10 04:03 | /styles/prosilver/theme/normal.css |
| 30 | 0.01% | 31/Oct/10 04:03 | /styles/prosilver/theme/large.css |
| 30 | 0.76% | 31/Oct/10 04:03 | /styles/prosilver/theme/print.css |
| 22 | 0.01% | 31/Oct/10 00:14 | /blog/ |
| 20 | 0.42% | 30/Oct/10 17:21 | /styles/prosilver/template/styleswitcher.js |
| 20 | 0.57% | 30/Oct/10 17:21 | /styles/prosilver/imageset/site_logo.gif |
| 20 | 0.73% | 30/Oct/10 17:21 | /styles/prosilver/template/forum_fn.js |
| 278 | 3.12% | 31/Oct/10 00:01 | [not listed: 59 files] |