 Web Server Statistics for Tatooine
Program started at Sun-31-May-2009 07:35.
Analysed requests from Sun-24-May-2009 08:00 to Sun-31-May-2009 07:00 (6.96 days).
Web Server Statistics for TatooineProgram started at Sun-31-May-2009 07:35.
Analysed requests from Sun-24-May-2009 08:00 to Sun-31-May-2009 07:00 (6.96 days).
(Go To: Top | General Summary | Daily Report | Hourly Summary | Organisation Report | Referrer Report | Referring Site Report | Browser Summary | Operating System Report | Status Code Report | File Size Report | File Type Report | Directory Report | Request Report)
This report contains overall statistics.
Successful requests: 1,472
Average successful requests per day: 211
Successful requests for pages: 190
Average successful requests for pages per day: 27
Failed requests: 9
Redirected requests: 2
Distinct files requested: 1,241
Distinct hosts served: 31
Data transferred: 4.30 megabytes
Average data transferred per day: 632.66 kilobytes
(Go To: Top | General Summary | Daily Report | Hourly Summary | Organisation Report | Referrer Report | Referring Site Report | Browser Summary | Operating System Report | Status Code Report | File Size Report | File Type Report | Directory Report | Request Report)
This report lists the activity in each day.
Each unit ( ) represents 1 request for a page.
| date | reqs | pages | |
|---|---|---|---|
| 24/May/09 | 17 | 16 |  |
| 25/May/09 | 28 | 25 |  |
| 26/May/09 | 1289 | 38 |    |
| 27/May/09 | 34 | 26 | |
| 28/May/09 | 28 | 25 | |
| 29/May/09 | 31 | 25 | |
| 30/May/09 | 35 | 27 | |
| 31/May/09 | 10 | 8 | |
Busiest day: 26/May/09 (38 requests for pages).
(Go To: Top | General Summary | Daily Report | Hourly Summary | Organisation Report | Referrer Report | Referring Site Report | Browser Summary | Operating System Report | Status Code Report | File Size Report | File Type Report | Directory Report | Request Report)
This report lists the total activity for each hour of the day, summed over all the days in the report.
Each unit () represents 1 request for a page.
| hour | reqs | pages | |
|---|---|---|---|
| 0 | 16 | 8 | |
| 1 | 10 | 7 | |
| 2 | 8 | 7 | |
| 3 | 9 | 7 | |
| 4 | 7 | 7 | |
| 5 | 7 | 7 | |
| 6 | 11 | 9 | |
| 7 | 9 | 7 | |
| 8 | 8 | 8 | |
| 9 | 11 | 8 | |
| 10 | 7 | 7 | |
| 11 | 1272 | 20 | |
| 12 | 9 | 8 | |
| 13 | 9 | 7 | |
| 14 | 8 | 7 | |
| 15 | 7 | 7 | |
| 16 | 7 | 7 | |
| 17 | 7 | 7 | |
| 18 | 10 | 8 | |
| 19 | 8 | 8 | |
| 20 | 8 | 7 | |
| 21 | 8 | 7 | |
| 22 | 7 | 7 | |
| 23 | 9 | 8 | |
(Go To: Top | General Summary | Daily Report | Hourly Summary | Organisation Report | Referrer Report | Referring Site Report | Browser Summary | Operating System Report | Status Code Report | File Size Report | File Type Report | Directory Report | Request Report)
This report lists the organisations of the computers which requested files.
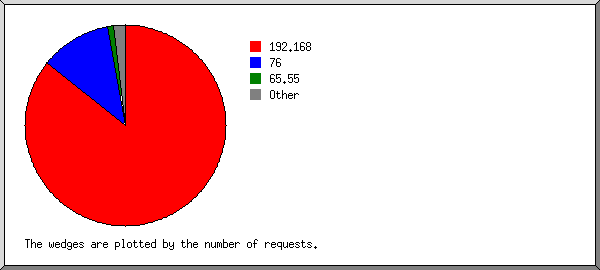
Listing organisations, sorted by the number of requests.
| reqs | %bytes | organisation |
|---|---|---|
| 1262 | 79.28% | 192.168 |
| 168 | 76 | |
| 15 | 0.02% | 65.55 |
| 6 | 0.01% | 216.129 |
| 5 | 0.29% | 208.80 |
| 4 | 195.210 | |
| 3 | 0.12% | 72 |
| 3 | 66.249 | |
| 1 | 0.06% | 207.63 |
| 1 | 20.12% | 173.17 |
| 1 | 0.06% | 64.207 |
| 1 | 74 | |
| 1 | 131.107 | |
| 1 | 0.06% | 69 |
(Go To: Top | General Summary | Daily Report | Hourly Summary | Organisation Report | Referrer Report | Referring Site Report | Browser Summary | Operating System Report | Status Code Report | File Size Report | File Type Report | Directory Report | Request Report)
This report lists the referrers (where people followed links from, or pages which included this site's images).
Listing referring URLs, sorted by the number of requests.
| reqs | URL |
|---|---|
| 1 | http://mn-jeep.com/forum/showthread.php |
(Go To: Top | General Summary | Daily Report | Hourly Summary | Organisation Report | Referrer Report | Referring Site Report | Browser Summary | Operating System Report | Status Code Report | File Size Report | File Type Report | Directory Report | Request Report)
This report lists which servers people followed links from.
Listing referring sites, sorted by the number of requests.
| reqs | site |
|---|---|
| 1 | http://mn-jeep.com/ |
(Go To: Top | General Summary | Daily Report | Hourly Summary | Organisation Report | Referrer Report | Referring Site Report | Browser Summary | Operating System Report | Status Code Report | File Size Report | File Type Report | Directory Report | Request Report)
This report lists the vendors of visitors' browsers.
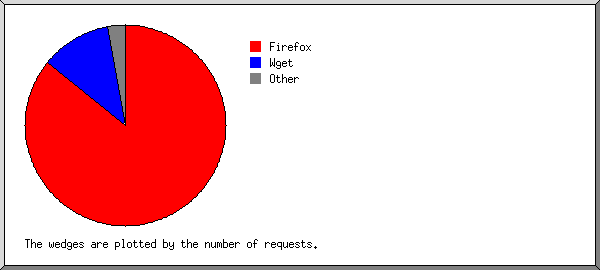
Listing browsers with at least 10 requests, sorted by the number of requests.
| no. | %reqs | reqs | pages | browser |
|---|---|---|---|---|
| 1 | 85.79% | 1262 | 12 | Firefox |
| 85.79% | 1262 | 12 | Firefox/3 | |
| 2 | 11.42% | 168 | 168 | Wget |
| 11.42% | 168 | 168 | Wget/1 | |
| 3 | 0.88% | 13 | 0 | msnbot |
| 0.75% | 11 | 0 | msnbot/2 | |
| 0.14% | 2 | 0 | msnbot/1 | |
| 1.90% | 28 | 9 | [not listed: 7 browsers] |
(Go To: Top | General Summary | Daily Report | Hourly Summary | Organisation Report | Referrer Report | Referring Site Report | Browser Summary | Operating System Report | Status Code Report | File Size Report | File Type Report | Directory Report | Request Report)
This report lists the operating systems used by visitors.
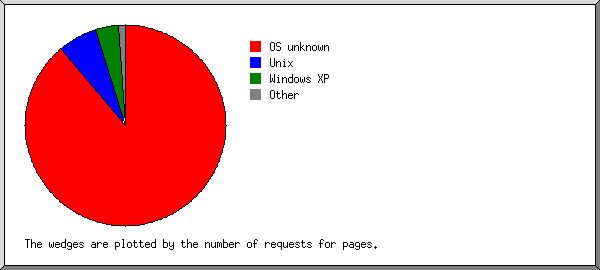
Listing operating systems, sorted by the number of requests for pages.
| no. | %reqs | reqs | pages | OS |
|---|---|---|---|---|
| 1 | 11.56% | 170 | 168 | OS unknown |
| 2 | 85.79% | 1262 | 12 | Unix |
| 85.79% | 1262 | 12 | Linux | |
| 3 | 0.61% | 9 | 8 | Windows |
| 0.48% | 7 | 7 | Windows XP | |
| 0.07% | 1 | 1 | Windows NT | |
| 0.07% | 1 | 0 | Unknown Windows | |
| 4 | 2.04% | 30 | 1 | Known robots |
(Go To: Top | General Summary | Daily Report | Hourly Summary | Organisation Report | Referrer Report | Referring Site Report | Browser Summary | Operating System Report | Status Code Report | File Size Report | File Type Report | Directory Report | Request Report)
This report lists the HTTP status codes of all requests.

Listing status codes, sorted numerically.
| reqs | status code |
|---|---|
| 1471 | 200 OK |
| 1 | 206 Partial content |
| 2 | 301 Document moved permanently |
| 9 | 404 Document not found |
(Go To: Top | General Summary | Daily Report | Hourly Summary | Organisation Report | Referrer Report | Referring Site Report | Browser Summary | Operating System Report | Status Code Report | File Size Report | File Type Report | Directory Report | Request Report)
This report lists the sizes of files.
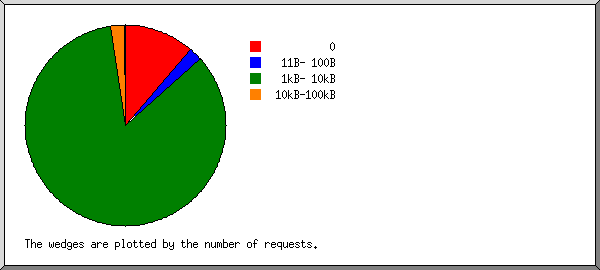
| size | reqs | %bytes |
|---|---|---|
| 0 | 168 | |
| 1B- 10B | 0 | |
| 11B- 100B | 31 | 0.03% |
| 101B- 1kB | 1 | 0.02% |
| 1kB- 10kB | 1238 | 58.47% |
| 10kB-100kB | 33 | 21.36% |
| 100kB- 1MB | 1 | 20.12% |
(Go To: Top | General Summary | Daily Report | Hourly Summary | Organisation Report | Referrer Report | Referring Site Report | Browser Summary | Operating System Report | Status Code Report | File Size Report | File Type Report | Directory Report | Request Report)
This report lists the extensions of files.
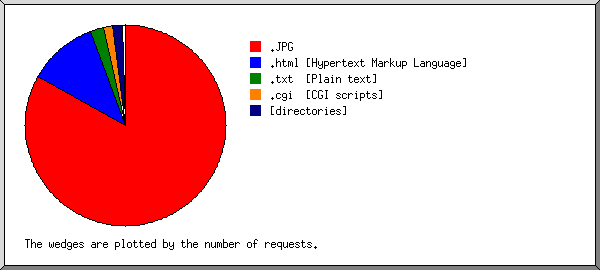
Listing extensions, sorted by the number of requests.
| reqs | %bytes | extension |
|---|---|---|
| 1222 | 57.51% | .JPG |
| 168 | .html [Hypertext Markup Language] | |
| 31 | 0.03% | .txt [Plain text] |
| 22 | 13.95% | .cgi [CGI scripts] |
| 22 | 7.67% | [directories] |
| 2 | 20.23% | .jpg [JPEG graphics] |
| 2 | 0.09% | .gif [GIF graphics] |
| 2 | 0.49% | .THM |
| 1 | 0.02% | .ico |
(Go To: Top | General Summary | Daily Report | Hourly Summary | Organisation Report | Referrer Report | Referring Site Report | Browser Summary | Operating System Report | Status Code Report | File Size Report | File Type Report | Directory Report | Request Report)
This report lists the directories from which files were requested. (The figures for each directory include all of its subdirectories.)
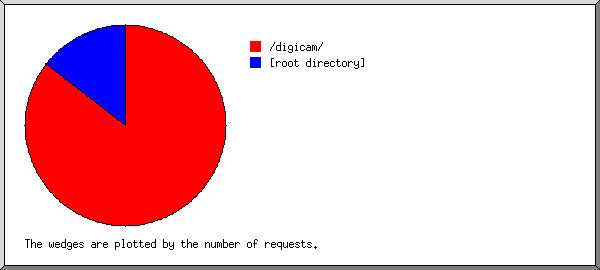
Listing directories, sorted by the number of requests.
| reqs | %reqs | %pages | directory |
|---|---|---|---|
| 1258 | 85.46% | 5.79% | /digicam/ |
| 1256 | 85.33% | 5.26% | /digicam/2009/ |
| 391 | 26.56% | 0.53% | /digicam/2009/20090523/ |
| 298 | 20.24% | 0.53% | /digicam/2009/20090502/ |
| 111 | 7.54% | 0.53% | /digicam/2009/20090515/ |
| 106 | 7.20% | 0.53% | /digicam/2009/20090426/ |
| 103 | 7.00% | 0.53% | /digicam/2009/20090423/ |
| 95 | 6.45% | 0.53% | /digicam/2009/20090506/ |
| 73 | 4.96% | 0.53% | /digicam/2009/20090429/ |
| 61 | 4.14% | 0.53% | /digicam/2009/20090503/ |
| 17 | 1.15% | 0.53% | /digicam/2009/20090425/ |
| 1 | 0.07% | /digicam/2005/ | |
| 1 | 0.07% | /digicam/2005/20050807/ | |
| 214 | 14.54% | 94.21% | [root directory] |
(Go To: Top | General Summary | Daily Report | Hourly Summary | Organisation Report | Referrer Report | Referring Site Report | Browser Summary | Operating System Report | Status Code Report | File Size Report | File Type Report | Directory Report | Request Report)
This report lists the files on the site.
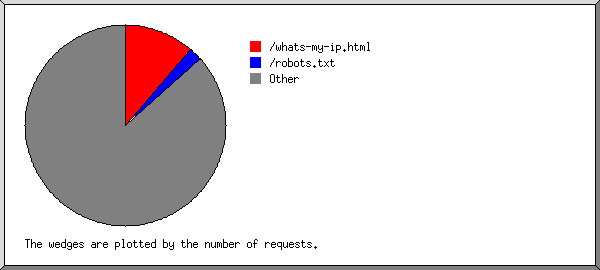
Listing files with at least 20 requests, sorted by the number of requests.
| reqs | %bytes | last time | file |
|---|---|---|---|
| 168 | 31/May/09 07:00 | /whats-my-ip.html | |
| 31 | 0.03% | 31/May/09 03:58 | /robots.txt |
| 1273 | 99.97% | 30/May/09 23:15 | [not listed: 1,221 files] |