 Web Server Statistics for Tatooine
Program started at Sat-30-Apr-2011 07:35.
Analysed requests from Sun-24-Apr-2011 16:19 to Sat-30-Apr-2011 07:06 (5.62 days).
Web Server Statistics for TatooineProgram started at Sat-30-Apr-2011 07:35.
Analysed requests from Sun-24-Apr-2011 16:19 to Sat-30-Apr-2011 07:06 (5.62 days).
(Go To: Top | General Summary | Daily Report | Hourly Summary | Organisation Report | Referrer Report | Referring Site Report | Browser Summary | Operating System Report | Status Code Report | File Size Report | File Type Report | Directory Report | Request Report)
This report contains overall statistics.
Successful requests: 18,096
Average successful requests per day: 3,222
Successful requests for pages: 544
Average successful requests for pages per day: 96
Failed requests: 33
Redirected requests: 1
Distinct files requested: 84
Distinct hosts served: 27
Data transferred: 41.25 megabytes
Average data transferred per day: 7.35 megabytes
(Go To: Top | General Summary | Daily Report | Hourly Summary | Organisation Report | Referrer Report | Referring Site Report | Browser Summary | Operating System Report | Status Code Report | File Size Report | File Type Report | Directory Report | Request Report)
This report lists the activity in each day.
Each unit ( ) represents 8 requests for pages or part thereof.
| date | reqs | pages | |
|---|---|---|---|
| 24/Apr/11 | 5 | 0 | |
| 25/Apr/11 | 8 | 2 | |
| 26/Apr/11 | 4 | 2 | |
| 27/Apr/11 | 562 | 21 |  |
| 28/Apr/11 | 9824 | 290 |   |
| 29/Apr/11 | 7689 | 228 |   |
| 30/Apr/11 | 4 | 1 | |
Busiest day: 28/Apr/11 (290 requests for pages).
(Go To: Top | General Summary | Daily Report | Hourly Summary | Organisation Report | Referrer Report | Referring Site Report | Browser Summary | Operating System Report | Status Code Report | File Size Report | File Type Report | Directory Report | Request Report)
This report lists the total activity for each hour of the day, summed over all the days in the report.
Each unit () represents 1 request for a page.
| hour | reqs | pages | |
|---|---|---|---|
| 0 | 817 | 24 | |
| 1 | 816 | 24 | |
| 2 | 816 | 24 | |
| 3 | 817 | 24 | |
| 4 | 818 | 25 | |
| 5 | 816 | 24 | |
| 6 | 818 | 26 | |
| 7 | 818 | 24 | |
| 8 | 816 | 24 | |
| 9 | 817 | 25 | |
| 10 | 825 | 26 | |
| 11 | 816 | 24 | |
| 12 | 816 | 24 | |
| 13 | 817 | 25 | |
| 14 | 783 | 23 | |
| 15 | 818 | 26 | |
| 16 | 817 | 24 | |
| 17 | 849 | 25 | |
| 18 | 783 | 23 | |
| 19 | 409 | 12 | |
| 20 | 412 | 12 | |
| 21 | 409 | 12 | |
| 22 | 555 | 20 | |
| 23 | 818 | 24 | |
(Go To: Top | General Summary | Daily Report | Hourly Summary | Organisation Report | Referrer Report | Referring Site Report | Browser Summary | Operating System Report | Status Code Report | File Size Report | File Type Report | Directory Report | Request Report)
This report lists the organisations of the computers which requested files.

Listing the top 20 organisations by the number of requests, sorted by the number of requests.
| reqs | %bytes | organisation |
|---|---|---|
| 18027 | 90.61% | 192.168 |
| 30 | 0.02% | 218.213 |
| 7 | 0.09% | 198.183 |
| 4 | 0.01% | 77 |
| 3 | 0.02% | 208.80 |
| 2 | 0.01% | 50 |
| 2 | 38 | |
| 2 | 2.10% | 97 |
| 2 | 2.51% | 24.197 |
| 2 | 123 | |
| 2 | 66.249 | |
| 2 | 0.01% | 67.195 |
| 2 | 119 | |
| 1 | 2.10% | 70 |
| 1 | 0.08% | 173.158 |
| 1 | 0.08% | 71 |
| 1 | 2.10% | 173.31 |
| 1 | 95 | |
| 1 | 0.13% | 87 |
| 1 | 0.01% | 88 |
| 2 | 0.13% | [not listed: 2 organisations] |
(Go To: Top | General Summary | Daily Report | Hourly Summary | Organisation Report | Referrer Report | Referring Site Report | Browser Summary | Operating System Report | Status Code Report | File Size Report | File Type Report | Directory Report | Request Report)
This report lists the referrers (where people followed links from, or pages which included this site's images).
Listing referring URLs, sorted by the number of requests.
(Go To: Top | General Summary | Daily Report | Hourly Summary | Organisation Report | Referrer Report | Referring Site Report | Browser Summary | Operating System Report | Status Code Report | File Size Report | File Type Report | Directory Report | Request Report)
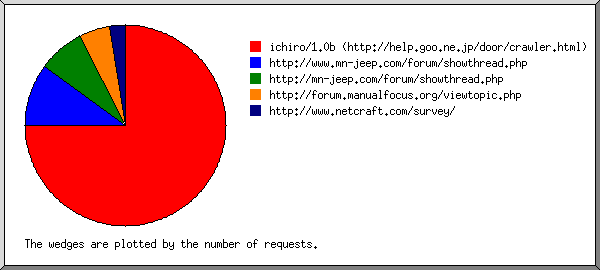
This report lists which servers people followed links from.
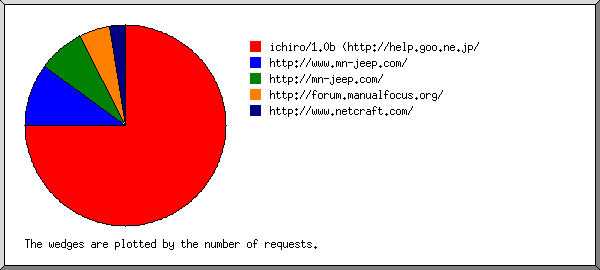
Listing referring sites, sorted by the number of requests.
| reqs | site |
|---|---|
| 30 | ichiro/1.0b (http://help.goo.ne.jp/ |
| 4 | http://www.mn-jeep.com/ |
| 3 | http://mn-jeep.com/ |
| 2 | http://forum.manualfocus.org/ |
| 1 | http://www.netcraft.com/ |
(Go To: Top | General Summary | Daily Report | Hourly Summary | Organisation Report | Referrer Report | Referring Site Report | Browser Summary | Operating System Report | Status Code Report | File Size Report | File Type Report | Directory Report | Request Report)
This report lists the vendors of visitors' browsers.

Listing browsers with at least 10 requests, sorted by the number of requests.
| no. | %reqs | reqs | pages | browser |
|---|---|---|---|---|
| 1 | 99.84% | 18037 | 534 | Firefox |
| 99.83% | 18036 | 534 | Firefox/3 | |
| 0.01% | 1 | 0 | Firefox/4 | |
| 0.16% | 29 | 10 | [not listed: 8 browsers] |
(Go To: Top | General Summary | Daily Report | Hourly Summary | Organisation Report | Referrer Report | Referring Site Report | Browser Summary | Operating System Report | Status Code Report | File Size Report | File Type Report | Directory Report | Request Report)
This report lists the operating systems used by visitors.
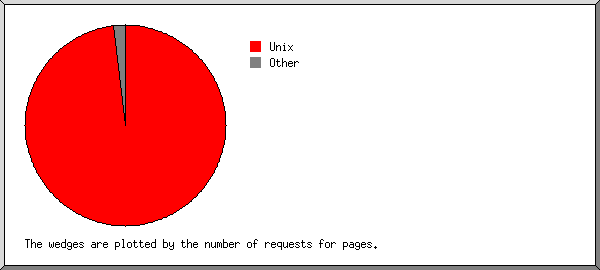
Listing operating systems, sorted by the number of requests for pages.
| no. | %reqs | reqs | pages | OS |
|---|---|---|---|---|
| 1 | 99.83% | 18035 | 534 | Unix |
| 99.83% | 18035 | 534 | Linux | |
| 2 | 0.04% | 8 | 5 | OS unknown |
| 3 | 0.06% | 11 | 3 | Windows |
| 0.02% | 3 | 3 | Windows XP | |
| 0.04% | 8 | 0 | Unknown Windows | |
| 4 | 0.06% | 11 | 2 | Known robots |
| 5 | 0.01% | 1 | 0 | Macintosh |
(Go To: Top | General Summary | Daily Report | Hourly Summary | Organisation Report | Referrer Report | Referring Site Report | Browser Summary | Operating System Report | Status Code Report | File Size Report | File Type Report | Directory Report | Request Report)
This report lists the HTTP status codes of all requests.
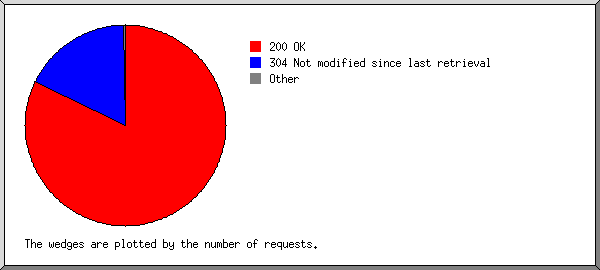
Listing status codes, sorted numerically.
| reqs | status code |
|---|---|
| 14896 | 200 OK |
| 1 | 206 Partial content |
| 1 | 301 Document moved permanently |
| 3199 | 304 Not modified since last retrieval |
| 5 | 401 Authentication required |
| 28 | 404 Document not found |
(Go To: Top | General Summary | Daily Report | Hourly Summary | Organisation Report | Referrer Report | Referring Site Report | Browser Summary | Operating System Report | Status Code Report | File Size Report | File Type Report | Directory Report | Request Report)
This report lists the sizes of files.
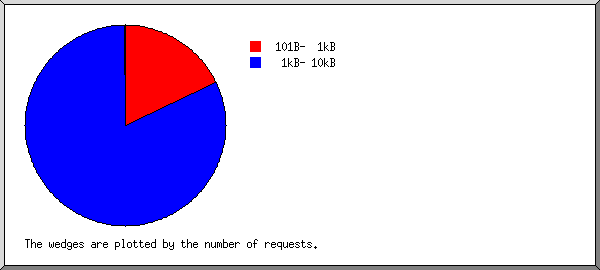
| size | reqs | %bytes |
|---|---|---|
| 0 | 0 | |
| 1B- 10B | 0 | |
| 11B- 100B | 0 | |
| 101B- 1kB | 3247 | 1.43% |
| 1kB- 10kB | 14838 | 89.28% |
| 10kB-100kB | 6 | 0.50% |
| 100kB- 1MB | 5 | 8.80% |
(Go To: Top | General Summary | Daily Report | Hourly Summary | Organisation Report | Referrer Report | Referring Site Report | Browser Summary | Operating System Report | Status Code Report | File Size Report | File Type Report | Directory Report | Request Report)
This report lists the extensions of files.
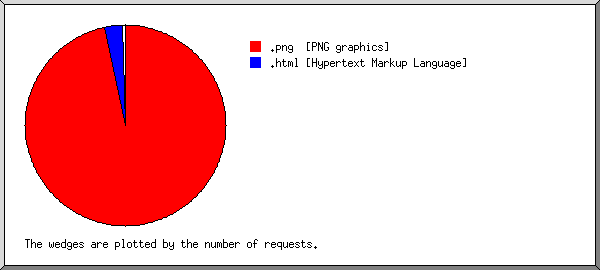
Listing extensions, sorted by the number of requests.
| reqs | %bytes | extension |
|---|---|---|
| 17489 | 90.30% | .png [PNG graphics] |
| 532 | 0.28% | .html [Hypertext Markup Language] |
| 38 | 8.99% | .jpg [JPEG graphics] |
| 12 | 0.01% | .txt [Plain text] |
| 12 | 0.06% | [directories] |
| 5 | 0.01% | .gif [GIF graphics] |
| 4 | 0.01% | .ico |
| 2 | 0.08% | .mp3 [MP3 sound files] |
| 2 | 0.26% | .JPG |
(Go To: Top | General Summary | Daily Report | Hourly Summary | Organisation Report | Referrer Report | Referring Site Report | Browser Summary | Operating System Report | Status Code Report | File Size Report | File Type Report | Directory Report | Request Report)
This report lists the directories from which files were requested. (The figures for each directory include all of its subdirectories.)
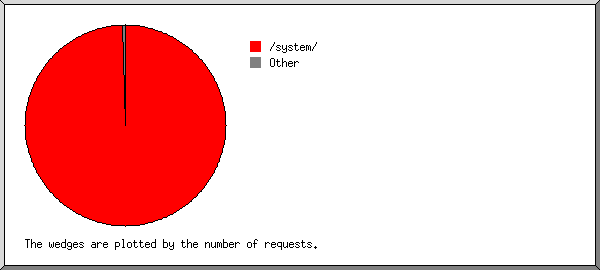
Listing directories, sorted by the number of requests.
| reqs | %reqs | %pages | directory |
|---|---|---|---|
| 18025 | 99.61% | 97.98% | /system/ |
| 18021 | 99.59% | 97.79% | /system/mrtg/ |
| 39 | 0.22% | /digicam/ | |
| 30 | 0.17% | /digicam/2002/ | |
| 30 | 0.17% | /digicam/2002/20021228/ | |
| 7 | 0.04% | /digicam/2005/ | |
| 7 | 0.04% | /digicam/2005/20050807/ | |
| 2 | 0.01% | /digicam/2007/ | |
| 26 | 0.14% | 1.84% | [root directory] |
| 3 | 0.02% | /icons/ | |
| 3 | 0.02% | 0.18% | /mp3/ |
| 3 | 0.02% | 0.18% | /mp3/Misc/ |
(Go To: Top | General Summary | Daily Report | Hourly Summary | Organisation Report | Referrer Report | Referring Site Report | Browser Summary | Operating System Report | Status Code Report | File Size Report | File Type Report | Directory Report | Request Report)
This report lists the files on the site.
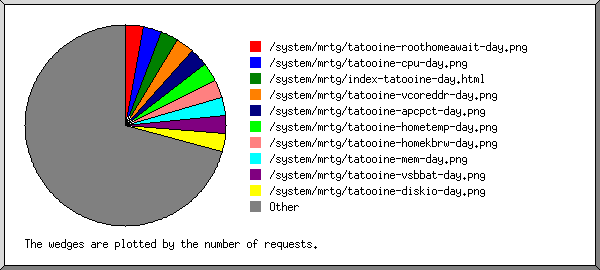
Listing files with at least 20 requests, sorted by the number of requests.
| reqs | %bytes | last time | file |
|---|---|---|---|
| 531 | 5.55% | 29/Apr/11 18:50 | /system/mrtg/tatooine-roothomeawait-day.png |
| 530 | 4.93% | 29/Apr/11 18:50 | /system/mrtg/tatooine-cpu-day.png |
| 530 | 0.26% | 29/Apr/11 18:50 | /system/mrtg/index-tatooine-day.html |
| 530 | 2.09% | 29/Apr/11 18:50 | /system/mrtg/tatooine-vcoreddr-day.png |
| 530 | 2.42% | 29/Apr/11 18:50 | /system/mrtg/tatooine-apcpct-day.png |
| 530 | 2.95% | 29/Apr/11 18:50 | /system/mrtg/tatooine-hometemp-day.png |
| 530 | 2.56% | 29/Apr/11 18:50 | /system/mrtg/tatooine-homekbrw-day.png |
| 530 | 3.28% | 29/Apr/11 18:50 | /system/mrtg/tatooine-mem-day.png |
| 530 | 2.09% | 29/Apr/11 18:50 | /system/mrtg/tatooine-vsbbat-day.png |
| 530 | 3.23% | 29/Apr/11 18:50 | /system/mrtg/tatooine-rootkbrw-day.png |
| 530 | 3.32% | 29/Apr/11 18:50 | /system/mrtg/tatooine-page-day.png |
| 530 | 2.30% | 29/Apr/11 18:50 | /system/mrtg/tatooine-freeswap-day.png |
| 530 | 2.09% | 29/Apr/11 18:50 | /system/mrtg/tatooine-5v12v-day.png |
| 530 | 3.93% | 29/Apr/11 18:50 | /system/mrtg/tatooine-int-day.png |
| 530 | 3.07% | 29/Apr/11 18:50 | /system/mrtg/tatooine-backuptemp-day.png |
| 530 | 2.31% | 29/Apr/11 18:50 | /system/mrtg/tatooine-backupkbrw-day.png |
| 530 | 3.44% | 29/Apr/11 18:50 | /system/mrtg/tatooine-rootrw-day.png |
| 530 | 2.43% | 29/Apr/11 18:50 | /system/mrtg/tatooine-rootspace-day.png |
| 530 | 3.80% | 29/Apr/11 18:50 | /system/mrtg/tatooine-eth1-day.png |
| 530 | 2.42% | 29/Apr/11 18:50 | /system/mrtg/tatooine-homespace-day.png |
| 530 | 3.53% | 29/Apr/11 18:50 | /system/mrtg/tatooine-coretemp-day.png |
| 530 | 2.47% | 29/Apr/11 18:50 | /system/mrtg/tatooine-backuprw-day.png |
| 530 | 2.88% | 29/Apr/11 18:50 | /system/mrtg/tatooine-disktemp-day.png |
| 530 | 5.91% | 29/Apr/11 18:50 | /system/mrtg/tatooine-localhost-day.png |
| 530 | 2.38% | 29/Apr/11 18:50 | /system/mrtg/tatooine-apcv-day.png |
| 530 | 3.02% | 29/Apr/11 18:50 | /system/mrtg/tatooine-roothomeutil-day.png |
| 530 | 2.99% | 29/Apr/11 18:50 | /system/mrtg/tatooine-homerw-day.png |
| 530 | 4.50% | 29/Apr/11 18:50 | /system/mrtg/tatooine-load-day.png |
| 530 | 3.23% | 29/Apr/11 18:50 | /system/mrtg/tatooine-diskio-day.png |
| 529 | 0.23% | 29/Apr/11 18:50 | /system/mrtg/mrtg-l.png |
| 529 | 0.24% | 29/Apr/11 18:50 | /system/mrtg/tatooine-temp12-day.png |
| 529 | 0.23% | 29/Apr/11 18:50 | /system/mrtg/mrtg-m.png |
| 529 | 0.23% | 29/Apr/11 18:50 | /system/mrtg/mrtg-r.png |
| 529 | 0.23% | 29/Apr/11 18:50 | /system/mrtg/tatooine-fan12rpm-day.png |
| 80 | 9.47% | 30/Apr/11 07:06 | [not listed: 50 files] |