 Web Server Statistics for Tatooine
Program started at Wed-31-Aug-2011 07:35.
Analysed requests from Sun-28-Aug-2011 10:26 to Wed-31-Aug-2011 05:38 (2.80 days).
Web Server Statistics for TatooineProgram started at Wed-31-Aug-2011 07:35.
Analysed requests from Sun-28-Aug-2011 10:26 to Wed-31-Aug-2011 05:38 (2.80 days).
(Go To: Top | General Summary | Daily Report | Hourly Summary | Organisation Report | Browser Summary | Operating System Report | Status Code Report | File Size Report | File Type Report | Directory Report | Request Report)
This report contains overall statistics.
Successful requests: 33
Average successful requests per day: 11
Successful requests for pages: 5
Average successful requests for pages per day: 1
Failed requests: 32
Distinct files requested: 5
Distinct hosts served: 11
Data transferred: 16.13 kilobytes
Average data transferred per day: 5.76 kilobytes
(Go To: Top | General Summary | Daily Report | Hourly Summary | Organisation Report | Browser Summary | Operating System Report | Status Code Report | File Size Report | File Type Report | Directory Report | Request Report)
This report lists the activity in each day.
Each unit ( ) represents 1 request for a page.
| date | reqs | pages | |
|---|---|---|---|
| 28/Aug/11 | 7 | 2 |  |
| 29/Aug/11 | 11 | 1 | |
| 30/Aug/11 | 11 | 2 | |
| 31/Aug/11 | 4 | 0 |
Busiest day: 28/Aug/11 (2 requests for pages).
(Go To: Top | General Summary | Daily Report | Hourly Summary | Organisation Report | Browser Summary | Operating System Report | Status Code Report | File Size Report | File Type Report | Directory Report | Request Report)
This report lists the total activity for each hour of the day, summed over all the days in the report.
Each unit () represents 1 request for a page.
| hour | reqs | pages | |
|---|---|---|---|
| 0 | 3 | 0 | |
| 1 | 0 | 0 | |
| 2 | 0 | 0 | |
| 3 | 1 | 0 | |
| 4 | 2 | 0 | |
| 5 | 3 | 0 | |
| 6 | 0 | 0 | |
| 7 | 1 | 0 | |
| 8 | 0 | 0 | |
| 9 | 1 | 0 | |
| 10 | 4 | 2 | |
| 11 | 3 | 0 | |
| 12 | 2 | 0 | |
| 13 | 1 | 0 | |
| 14 | 6 | 3 | |
| 15 | 1 | 0 | |
| 16 | 0 | 0 | |
| 17 | 2 | 0 | |
| 18 | 0 | 0 | |
| 19 | 2 | 0 | |
| 20 | 1 | 0 | |
| 21 | 0 | 0 | |
| 22 | 0 | 0 | |
| 23 | 0 | 0 |
(Go To: Top | General Summary | Daily Report | Hourly Summary | Organisation Report | Browser Summary | Operating System Report | Status Code Report | File Size Report | File Type Report | Directory Report | Request Report)
This report lists the organisations of the computers which requested files.
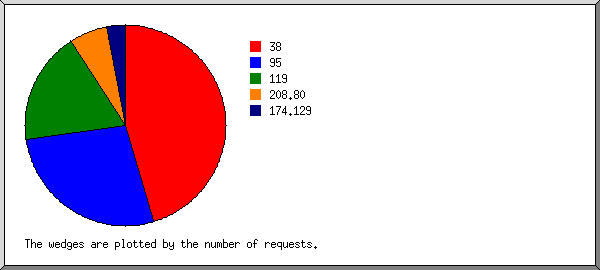
Listing organisations, sorted by the number of requests.
| reqs | %bytes | organisation |
|---|---|---|
| 15 | 27.51% | 38 |
| 9 | 12.14% | 95 |
| 6 | 24.49% | 119 |
| 2 | 34.31% | 208.80 |
| 1 | 1.55% | 174.129 |
(Go To: Top | General Summary | Daily Report | Hourly Summary | Organisation Report | Browser Summary | Operating System Report | Status Code Report | File Size Report | File Type Report | Directory Report | Request Report)
This report lists the vendors of visitors' browsers.
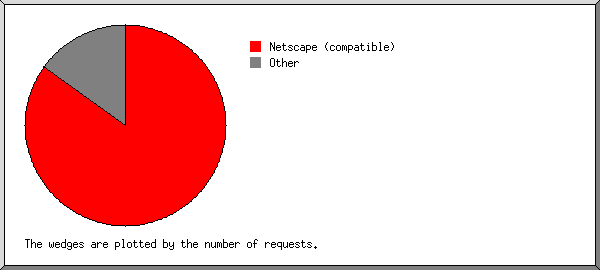
Listing browsers with at least 10 requests, sorted by the number of requests.
| no. | %reqs | reqs | pages | browser |
|---|---|---|---|---|
| 1 | 84.85% | 28 | 3 | Netscape (compatible) |
| 15.15% | 5 | 2 | [not listed: 2 browsers] |
(Go To: Top | General Summary | Daily Report | Hourly Summary | Organisation Report | Browser Summary | Operating System Report | Status Code Report | File Size Report | File Type Report | Directory Report | Request Report)
This report lists the operating systems used by visitors.
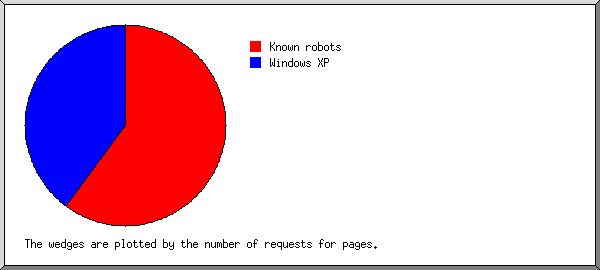
Listing operating systems, sorted by the number of requests for pages.
| no. | %reqs | reqs | pages | OS |
|---|---|---|---|---|
| 1 | 18.18% | 6 | 3 | Known robots |
| 2 | 6.06% | 2 | 2 | Windows |
| 6.06% | 2 | 2 | Windows XP | |
| 3 | 75.76% | 25 | 0 | OS unknown |
(Go To: Top | General Summary | Daily Report | Hourly Summary | Organisation Report | Browser Summary | Operating System Report | Status Code Report | File Size Report | File Type Report | Directory Report | Request Report)
This report lists the HTTP status codes of all requests.
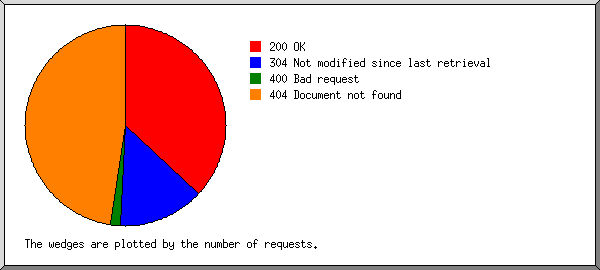
Listing status codes, sorted numerically.
| reqs | status code |
|---|---|
| 24 | 200 OK |
| 9 | 304 Not modified since last retrieval |
| 1 | 400 Bad request |
| 31 | 404 Document not found |
(Go To: Top | General Summary | Daily Report | Hourly Summary | Organisation Report | Browser Summary | Operating System Report | Status Code Report | File Size Report | File Type Report | Directory Report | Request Report)
This report lists the sizes of files.
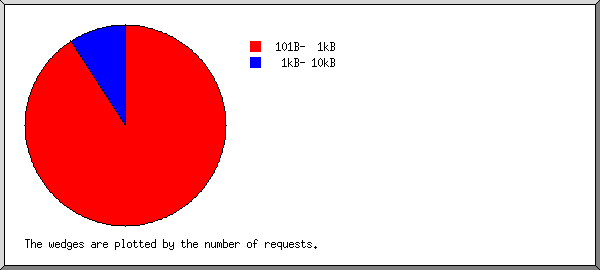
| size | reqs | %bytes |
|---|---|---|
| 0 | 0 | |
| 1B- 10B | 0 | |
| 11B- 100B | 0 | |
| 101B- 1kB | 30 | 48.53% |
| 1kB- 10kB | 3 | 51.47% |
(Go To: Top | General Summary | Daily Report | Hourly Summary | Organisation Report | Browser Summary | Operating System Report | Status Code Report | File Size Report | File Type Report | Directory Report | Request Report)
This report lists the extensions of files.
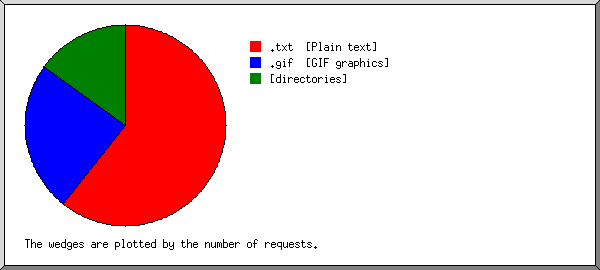
Listing extensions, sorted by the number of requests.
| reqs | %bytes | extension |
|---|---|---|
| 20 | 37.15% | .txt [Plain text] |
| 8 | 9.56% | .gif [GIF graphics] |
| 5 | 53.30% | [directories] |
(Go To: Top | General Summary | Daily Report | Hourly Summary | Organisation Report | Browser Summary | Operating System Report | Status Code Report | File Size Report | File Type Report | Directory Report | Request Report)
This report lists the directories from which files were requested. (The figures for each directory include all of its subdirectories.)
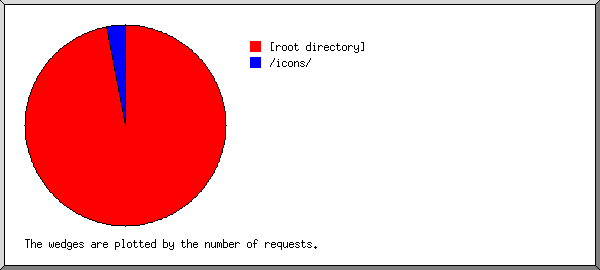
Listing directories, sorted by the number of requests.
| reqs | %reqs | %pages | directory |
|---|---|---|---|
| 32 | 96.97% | 100% | [root directory] |
| 1 | 3.03% | /icons/ |
(Go To: Top | General Summary | Daily Report | Hourly Summary | Organisation Report | Browser Summary | Operating System Report | Status Code Report | File Size Report | File Type Report | Directory Report | Request Report)
This report lists the files on the site.
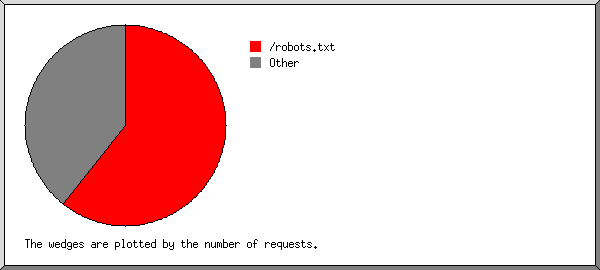
Listing files with at least 20 requests, sorted by the number of requests.
| reqs | %bytes | last time | file |
|---|---|---|---|
| 20 | 37.15% | 31/Aug/11 05:38 | /robots.txt |
| 13 | 62.85% | 31/Aug/11 04:44 | [not listed: 4 files] |