 Web Server Statistics for Tatooine
Program started at Sun-30-Jun-2013 07:35.
Analysed requests from Sun-23-Jun-2013 08:54 to Sun-30-Jun-2013 07:05 (6.92 days).
Web Server Statistics for TatooineProgram started at Sun-30-Jun-2013 07:35.
Analysed requests from Sun-23-Jun-2013 08:54 to Sun-30-Jun-2013 07:05 (6.92 days).
(Go To: Top | General Summary | Daily Report | Hourly Summary | Organisation Report | Referrer Report | Referring Site Report | Browser Summary | Operating System Report | Status Code Report | File Size Report | File Type Report | Directory Report | Request Report)
This report contains overall statistics.
Successful requests: 7,331
Average successful requests per day: 1,058
Successful requests for pages: 233
Average successful requests for pages per day: 33
Failed requests: 6
Distinct files requested: 50
Distinct hosts served: 22
Data transferred: 14.75 megabytes
Average data transferred per day: 2.13 megabytes
(Go To: Top | General Summary | Daily Report | Hourly Summary | Organisation Report | Referrer Report | Referring Site Report | Browser Summary | Operating System Report | Status Code Report | File Size Report | File Type Report | Directory Report | Request Report)
This report lists the activity in each day.
Each unit ( ) represents 5 requests for pages or part thereof.
| date | reqs | pages | |
|---|---|---|---|
| 23/Jun/13 | 5 | 2 | |
| 24/Jun/13 | 6539 | 195 |    |
| 25/Jun/13 | 755 | 25 | |
| 26/Jun/13 | 8 | 3 | |
| 27/Jun/13 | 2 | 1 | |
| 28/Jun/13 | 13 | 4 | |
| 29/Jun/13 | 7 | 3 | |
| 30/Jun/13 | 2 | 0 |
Busiest day: 24/Jun/13 (195 requests for pages).
(Go To: Top | General Summary | Daily Report | Hourly Summary | Organisation Report | Referrer Report | Referring Site Report | Browser Summary | Operating System Report | Status Code Report | File Size Report | File Type Report | Directory Report | Request Report)
This report lists the total activity for each hour of the day, summed over all the days in the report.
Each unit () represents 1 request for a page.
| hour | reqs | pages | |
|---|---|---|---|
| 0 | 408 | 12 |  |
| 1 | 340 | 10 | |
| 2 | 0 | 0 | |
| 3 | 0 | 0 | |
| 4 | 2 | 1 | |
| 5 | 2 | 1 | |
| 6 | 3 | 1 | |
| 7 | 3 | 1 | |
| 8 | 421 | 16 |  |
| 9 | 410 | 13 | |
| 10 | 411 | 12 | |
| 11 | 409 | 13 | |
| 12 | 412 | 13 | |
| 13 | 409 | 12 | |
| 14 | 408 | 12 | |
| 15 | 409 | 12 | |
| 16 | 408 | 12 | |
| 17 | 412 | 14 | |
| 18 | 413 | 14 | |
| 19 | 409 | 12 | |
| 20 | 415 | 15 | |
| 21 | 408 | 12 | |
| 22 | 409 | 12 | |
| 23 | 410 | 13 | |
(Go To: Top | General Summary | Daily Report | Hourly Summary | Organisation Report | Referrer Report | Referring Site Report | Browser Summary | Operating System Report | Status Code Report | File Size Report | File Type Report | Directory Report | Request Report)
This report lists the organisations of the computers which requested files.
Listing organisations, sorted by the number of requests.
| reqs | %bytes | organisation |
|---|---|---|
| 7283 | 86.94% | 127 |
| 17 | 0.10% | 65.55 |
| 5 | 0.01% | 66.249 |
| 4 | 0.07% | 208.180 |
| 4 | 0.01% | 199.21 |
| 2 | 192.168 | |
| 2 | 178.255 | |
| 2 | 0.01% | 81.209 |
| 2 | 0.01% | 180.76 |
| 2 | 0.01% | 157.55 |
| 1 | 5.87% | 50 |
| 1 | 0.36% | 80.200 |
| 1 | 0.36% | 82 |
| 1 | 173.199 | |
| 1 | 5.87% | 173.31 |
| 1 | 0.36% | 94 |
| 1 | 199.30 | |
| 1 | 0.01% | 123 |
(Go To: Top | General Summary | Daily Report | Hourly Summary | Organisation Report | Referrer Report | Referring Site Report | Browser Summary | Operating System Report | Status Code Report | File Size Report | File Type Report | Directory Report | Request Report)
This report lists the referrers (where people followed links from, or pages which included this site's images).
Listing referring URLs, sorted by the number of requests.
(Go To: Top | General Summary | Daily Report | Hourly Summary | Organisation Report | Referrer Report | Referring Site Report | Browser Summary | Operating System Report | Status Code Report | File Size Report | File Type Report | Directory Report | Request Report)
This report lists which servers people followed links from.
Listing referring sites, sorted by the number of requests.
| reqs | site |
|---|---|
| 7283 | http://tatooine/ |
| 3 | http://forum.manualfocus.org/ |
| 2 | http://www.mn-jeep.com/ |
| 1 | http://www.bing.com/ |
(Go To: Top | General Summary | Daily Report | Hourly Summary | Organisation Report | Referrer Report | Referring Site Report | Browser Summary | Operating System Report | Status Code Report | File Size Report | File Type Report | Directory Report | Request Report)
This report lists the vendors of visitors' browsers.
Listing browsers with at least 10 requests, sorted by the number of requests.
| no. | %reqs | reqs | pages | browser |
|---|---|---|---|---|
| 1 | 99.37% | 7285 | 216 | Safari |
| 99.35% | 7283 | 216 | Safari/537 | |
| 0.01% | 1 | 0 | Safari/534 | |
| 0.01% | 1 | 0 | Safari/533 | |
| 2 | 0.45% | 33 | 14 | Netscape (compatible) |
| 0.18% | 13 | 3 | [not listed: 6 browsers] |
(Go To: Top | General Summary | Daily Report | Hourly Summary | Organisation Report | Referrer Report | Referring Site Report | Browser Summary | Operating System Report | Status Code Report | File Size Report | File Type Report | Directory Report | Request Report)
This report lists the operating systems used by visitors.
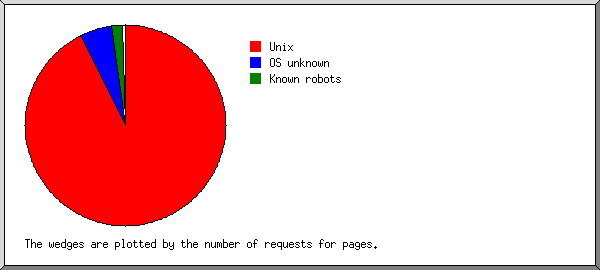
Listing operating systems, sorted by the number of requests for pages.
| no. | %reqs | reqs | pages | OS |
|---|---|---|---|---|
| 1 | 99.37% | 7285 | 216 | Unix |
| 99.37% | 7285 | 216 | Linux | |
| 2 | 0.41% | 30 | 12 | OS unknown |
| 3 | 0.11% | 8 | 4 | Known robots |
| 4 | 0.11% | 8 | 1 | Windows |
| 0.07% | 5 | 1 | Windows XP | |
| 0.04% | 3 | 0 | Windows 7 |
(Go To: Top | General Summary | Daily Report | Hourly Summary | Organisation Report | Referrer Report | Referring Site Report | Browser Summary | Operating System Report | Status Code Report | File Size Report | File Type Report | Directory Report | Request Report)
This report lists the HTTP status codes of all requests.
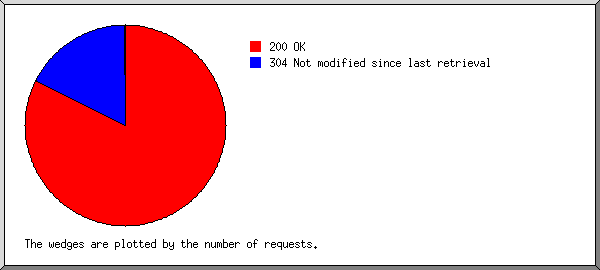
Listing status codes, sorted numerically.
| reqs | status code |
|---|---|
| 6046 | 200 OK |
| 1285 | 304 Not modified since last retrieval |
| 3 | 401 Authentication required |
| 2 | 404 Document not found |
| 1 | 405 Method not allowed |
(Go To: Top | General Summary | Daily Report | Hourly Summary | Organisation Report | Referrer Report | Referring Site Report | Browser Summary | Operating System Report | Status Code Report | File Size Report | File Type Report | Directory Report | Request Report)
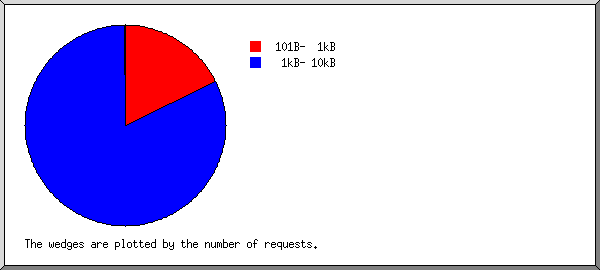
This report lists the sizes of files.
| size | reqs | %bytes |
|---|---|---|
| 0 | 0 | |
| 1B- 10B | 0 | |
| 11B- 100B | 0 | |
| 101B- 1kB | 1308 | 1.65% |
| 1kB- 10kB | 6018 | 85.54% |
| 10kB-100kB | 3 | 1.08% |
| 100kB- 1MB | 2 | 11.73% |
(Go To: Top | General Summary | Daily Report | Hourly Summary | Organisation Report | Referrer Report | Referring Site Report | Browser Summary | Operating System Report | Status Code Report | File Size Report | File Type Report | Directory Report | Request Report)
This report lists the extensions of files.
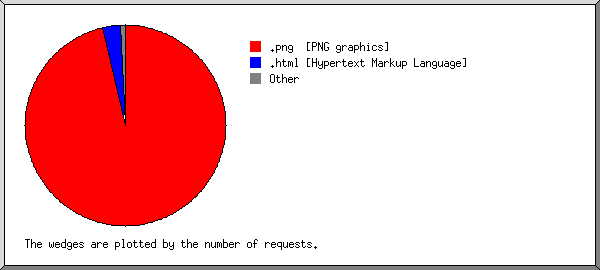
Listing extensions, sorted by the number of requests.
| reqs | %bytes | extension |
|---|---|---|
| 7067 | 86.62% | .png [PNG graphics] |
| 216 | 0.32% | .html [Hypertext Markup Language] |
| 21 | 0.05% | .txt [Plain text] |
| 17 | 0.13% | [directories] |
| 4 | 11.77% | .jpg [JPEG graphics] |
| 3 | 1.08% | .JPG |
| 2 | 0.03% | .gif [GIF graphics] |
| 1 | [no extension] |
(Go To: Top | General Summary | Daily Report | Hourly Summary | Organisation Report | Referrer Report | Referring Site Report | Browser Summary | Operating System Report | Status Code Report | File Size Report | File Type Report | Directory Report | Request Report)
This report lists the directories from which files were requested. (The figures for each directory include all of its subdirectories.)

Listing directories, sorted by the number of requests.
| reqs | %reqs | %pages | directory |
|---|---|---|---|
| 7283 | 99.35% | 92.70% | /system/ |
| 7283 | 99.35% | 92.70% | /system/mrtg/ |
| 43 | 0.59% | 7.30% | [root directory] |
| 5 | 0.07% | /digicam/ | |
| 3 | 0.04% | /digicam/2007/ | |
| 2 | 0.03% | /digicam/2005/ | |
| 2 | 0.03% | /digicam/2005/20050807/ |
(Go To: Top | General Summary | Daily Report | Hourly Summary | Organisation Report | Referrer Report | Referring Site Report | Browser Summary | Operating System Report | Status Code Report | File Size Report | File Type Report | Directory Report | Request Report)
This report lists the files on the site.
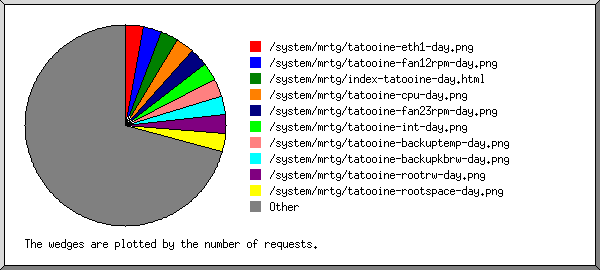
Listing files with at least 20 requests, sorted by the number of requests.
| reqs | %bytes | last time | file |
|---|---|---|---|
| 215 | 2.96% | 25/Jun/13 01:48 | /system/mrtg/tatooine-eth1-day.png |
| 215 | 2.94% | 25/Jun/13 01:48 | /system/mrtg/tatooine-fan12rpm-day.png |
| 214 | 0.29% | 25/Jun/13 01:48 | /system/mrtg/index-tatooine-day.html |
| 214 | 4.86% | 25/Jun/13 01:48 | /system/mrtg/tatooine-cpu-day.png |
| 214 | 2.57% | 25/Jun/13 01:48 | /system/mrtg/tatooine-fan23rpm-day.png |
| 214 | 3.54% | 25/Jun/13 01:48 | /system/mrtg/tatooine-int-day.png |
| 214 | 2.83% | 25/Jun/13 01:48 | /system/mrtg/tatooine-backuptemp-day.png |
| 214 | 0.26% | 25/Jun/13 01:48 | /system/mrtg/tatooine-backupkbrw-day.png |
| 214 | 2.78% | 25/Jun/13 01:48 | /system/mrtg/tatooine-rootrw-day.png |
| 214 | 2.65% | 25/Jun/13 01:48 | /system/mrtg/tatooine-rootspace-day.png |
| 214 | 2.72% | 25/Jun/13 01:48 | /system/mrtg/tatooine-homespace-day.png |
| 214 | 2.66% | 25/Jun/13 01:48 | /system/mrtg/tatooine-vcoreddr-day.png |
| 214 | 2.71% | 25/Jun/13 01:48 | /system/mrtg/tatooine-apcpct-day.png |
| 214 | 4.15% | 25/Jun/13 01:48 | /system/mrtg/tatooine-mem-day.png |
| 214 | 2.31% | 25/Jun/13 01:48 | /system/mrtg/tatooine-homekbrw-day.png |
| 214 | 3.08% | 25/Jun/13 01:48 | /system/mrtg/tatooine-hometemp-day.png |
| 214 | 0.26% | 25/Jun/13 01:48 | /system/mrtg/tatooine-backuprw-day.png |
| 214 | 3.19% | 25/Jun/13 01:48 | /system/mrtg/tatooine-coretemp-day.png |
| 214 | 2.91% | 25/Jun/13 01:48 | /system/mrtg/tatooine-disktemp-day.png |
| 214 | 2.82% | 25/Jun/13 01:48 | /system/mrtg/tatooine-roothomeawait-day.png |
| 214 | 3.76% | 25/Jun/13 01:48 | /system/mrtg/tatooine-localhost-day.png |
| 214 | 2.67% | 25/Jun/13 01:48 | /system/mrtg/tatooine-apcv-day.png |
| 214 | 2.66% | 25/Jun/13 01:48 | /system/mrtg/tatooine-roothomeutil-day.png |
| 214 | 2.47% | 25/Jun/13 01:48 | /system/mrtg/tatooine-homerw-day.png |
| 214 | 3.63% | 25/Jun/13 01:48 | /system/mrtg/tatooine-cpumb-day.png |
| 214 | 2.82% | 25/Jun/13 01:48 | /system/mrtg/tatooine-rootkbrw-day.png |
| 214 | 2.67% | 25/Jun/13 01:48 | /system/mrtg/tatooine-freeswap-day.png |
| 214 | 3.27% | 25/Jun/13 01:48 | /system/mrtg/tatooine-page-day.png |
| 214 | 3.74% | 25/Jun/13 01:48 | /system/mrtg/tatooine-load-day.png |
| 214 | 3.20% | 25/Jun/13 01:48 | /system/mrtg/tatooine-diskio-day.png |
| 214 | 2.65% | 25/Jun/13 01:48 | /system/mrtg/tatooine-5v12v-day.png |
| 213 | 0.26% | 25/Jun/13 01:48 | /system/mrtg/mrtg-l.png |
| 213 | 0.26% | 25/Jun/13 01:48 | /system/mrtg/mrtg-m.png |
| 213 | 0.26% | 25/Jun/13 01:48 | /system/mrtg/mrtg-r.png |
| 21 | 0.05% | 30/Jun/13 06:36 | /robots.txt |
| 35 | 13.14% | 30/Jun/13 07:05 | [not listed: 15 files] |